jupyter ntebook使用 | 臭大佬
简介
jupyter ntebook使用 | 臭大佬
说明
这里有用到两张表的数据,分别是一下两篇爬取的数据。
数据来源:
《网易云音乐爬取歌单 | 臭大佬》
《爬取网易云音乐歌单里面的歌曲 | 臭大佬》
jupyter ntebook 安装
jupyter ntebook 是一个交互式的笔记本,能够在上面记录文档以及运行各种代码。通常情况下,
我们使用 IDE 运行程序代码,程序运行完成之后,所有的记录和过程最后都只有结果能呈现出来;
而 jupyter notebook 就可以记录我们编码的每一个步骤和过程。
pip install jupyter

安装完成后,在需要运行 jupyter notebook 的目录下,打开命令行终端界面,在其中键入命令”jupyter notebook”回车就打开了一个本地的 jupyter 服务器
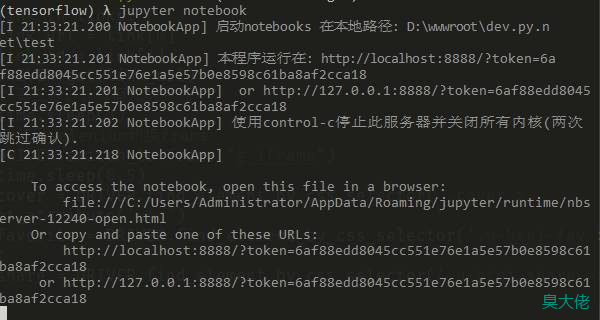
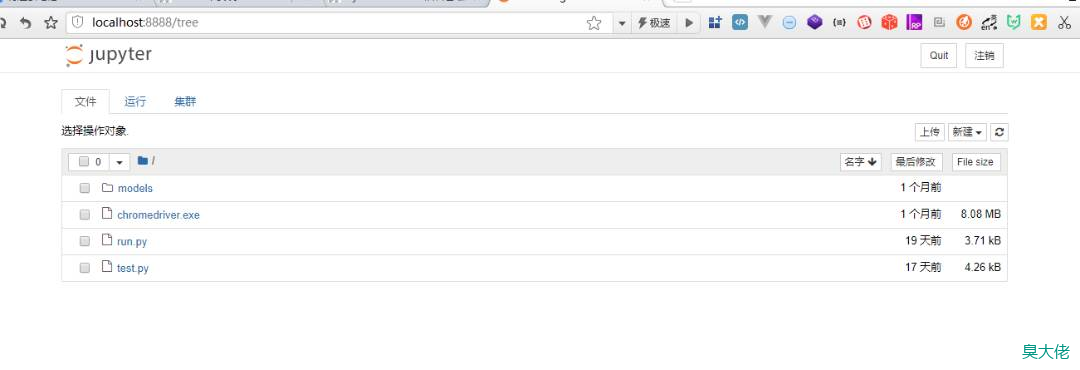
点击notebook下的python(python3),会打开个新标签页,我们可以用它来分析数据。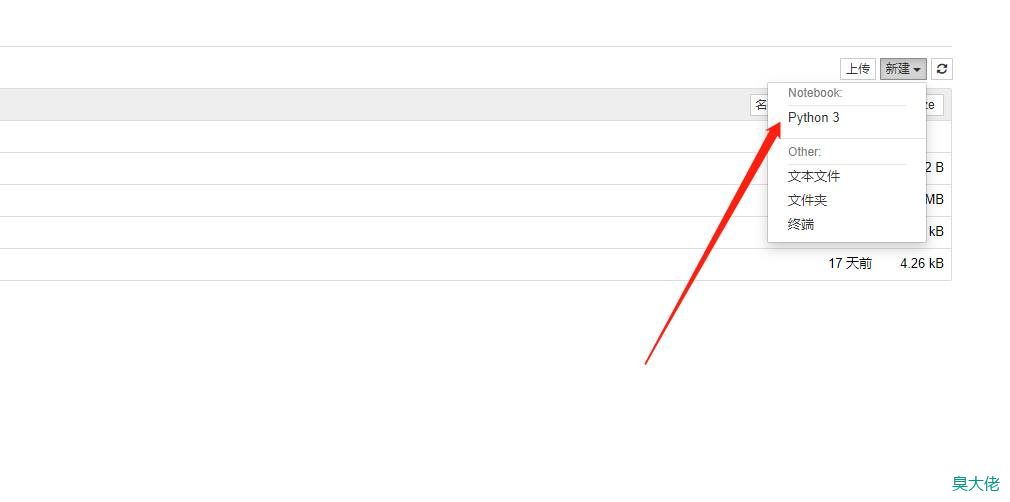
代码块
# coding:utf-8
import pandas
import pymysql
import matplotlib.pyplot as pyplot
# 设置中文显示和负号显示
from pylab import mpl

mpl.rcParams['font.sans-serif'] = ['SimHei']
mpl.rcParams['axes.unicode_minus'] = False
# 设置图形风格
pyplot.style.use('ggplot')


class WYSongList(object):
    '''
    歌单类
    '''

    def __init__(self):
        conn = pymysql.connect(host='localhost', port=3306, user='root', password='root', db='python_test',
                               charset='utf8')
        sql = "select title,favorite,share,comment,play_num,song_num from song_list"
        # 使用pandas.read_sql读取数
        self.pandas = pandas.read_sql(sql, conn)

    def original(self):
        '''
        原始表格展示
        :return:
        '''
        # 查看显示结果
        table = self.pandas.head()
        print(table)
        # # 查看数据形态
        # shape = self.pandas.shape
        # print(shape)
        # # 查看数据类型
        # dtypes = self.pandas.dtypes
        # print(dtypes)

    def playFun(self):
        '''
        播放次数
        :return:
        '''
        self.pandas['播放次数'] = self.pandas['play_num']
        # 以favorite降序排序,并以title去重
        res = self.pandas.sort_values('favorite', ascending=False).drop_duplicates('title').head()
        print(res)
        pyplot.figure(figsize=(10, 5))
        pyplot.title('网易云音乐歌单播放次数曲线')
        pyplot.xlabel('排名')
        pyplot.ylabel('播放次数')
        pyplot.plot(range(len(res['播放次数'])), res['播放次数'])
        pyplot.show()

    def favoriteFun(self):
        '''
        收藏次数
        :return:
        '''
        self.pandas['收藏次数'] = self.pandas['favorite']
        res = self.pandas.sort_values('收藏次数', ascending=False).drop_duplicates('title').head()
        print(res)
        pyplot.figure(figsize=(10, 5))
        pyplot.title('网易云音乐歌单收藏次数曲线')
        pyplot.xlabel('排名')
        pyplot.ylabel('收藏次数')
        pyplot.plot(range(len(res['收藏次数'])), res['收藏次数'])
        pyplot.show()

    def scatter(self):
        '''
       播放次数和收藏次数散点图
       :return:
       '''
        self.pandas['播放次数'] = self.pandas['play_num']
        self.pandas['收藏次数'] = self.pandas['favorite']
        pyplot.figure(figsize=(10, 5))
        pyplot.title('播放次数和收藏次数散点图')
        pyplot.xlabel('播放次数')
        pyplot.ylabel('收藏次数')
        pyplot.scatter( self.pandas['播放次数'],  self.pandas['收藏次数'], alpha=0.8)
        pyplot.show()


class WYSong(object):
    '''
    歌单
    '''

    def __init__(self):
        conn = pymysql.connect(host='localhost', port=3306, user='root', password='root', db='python_test',
                               charset='utf8')
        sql = "select cate_id,singer,album,title from song"
        # 使用pandas.read_sql读取数
        self.pandas = pandas.read_sql(sql, conn)

    def singerTj(self):
        '''
        歌手歌曲统计
        :return:
        '''
        res = self.pandas.groupby('singer')['title'].count().reset_index().sort_values('title', ascending=False).head(10)
        print(res)
        pyplot.title("歌手歌曲数")
        pyplot.xlabel('歌手')
        pyplot.ylabel('歌曲数')
        x = res['singer']
        y = res['title']
        pyplot.bar(range(len(y)), y, color='rgb', tick_label=x)
        pyplot.show()

    def songNum(self):
        '''
        统计出现次数最多的前10首歌曲
        :return:
        '''
        res = self.pandas.groupby('title')['album'].count().reset_index().sort_values('album', ascending = False).head(10)
        #print(res)
        x = range(len(res))
        pyplot.figure(figsize=(10, 5))
        pyplot.title('热度前10歌曲')
        pyplot.barh(x, res['album'], color='rgb')
        pyplot.yticks(x, res['title'])
        pyplot.show()


if __name__ == '__main__':
    # list = WYSongList()
    # list.scatter()
    song = WYSong()
    song.songNum()
jupyter ntebook使用
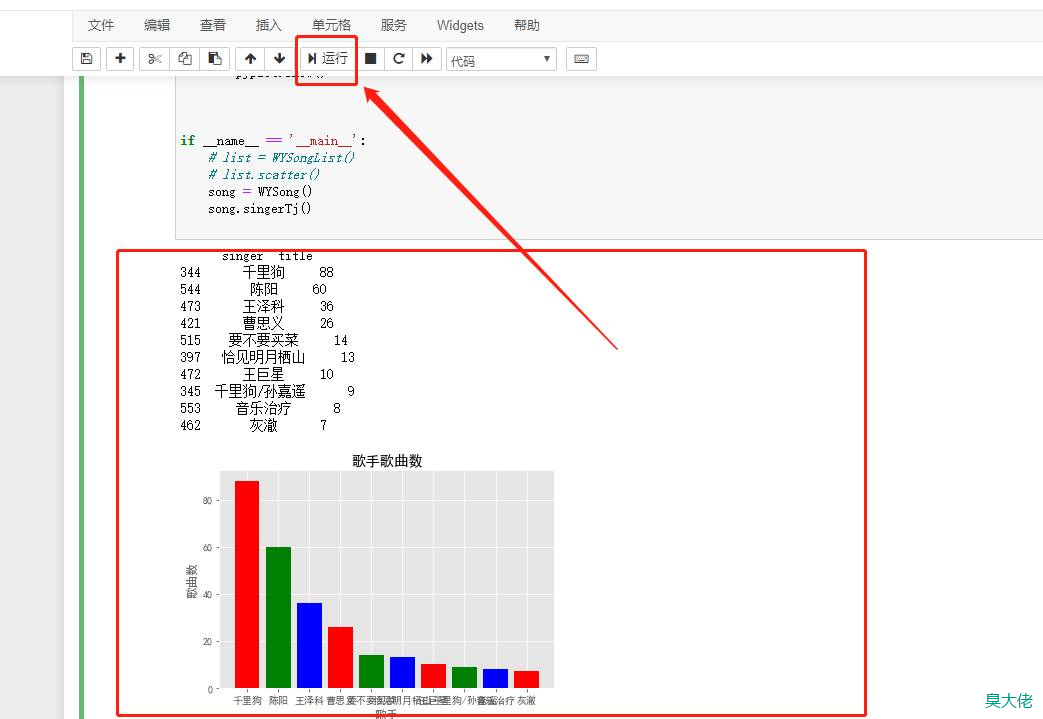
代码如上,需要运行时,把代码复制到notebook中。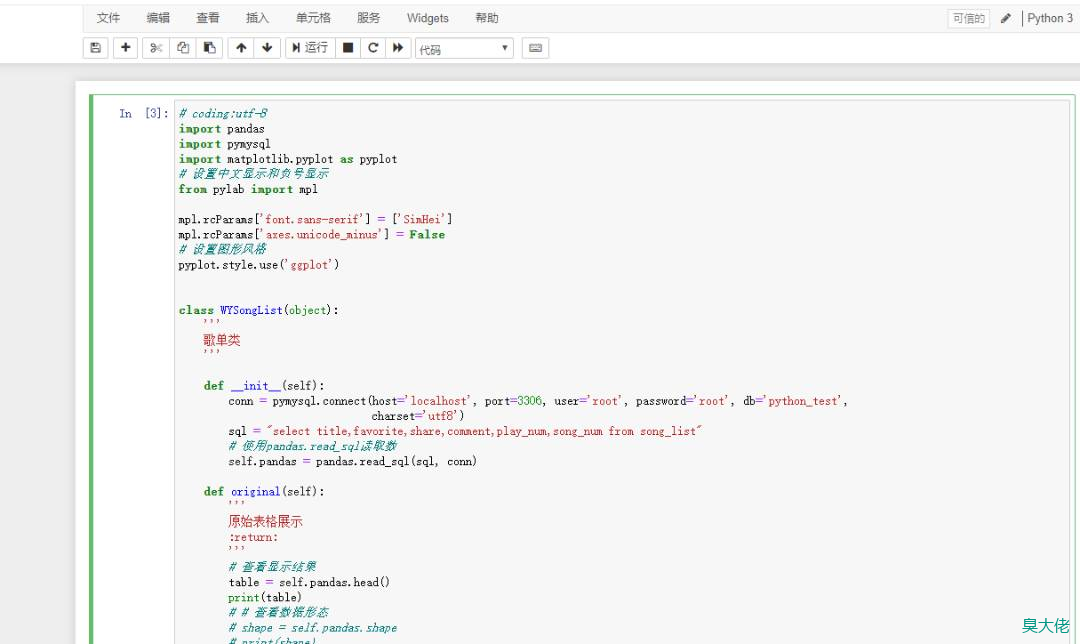
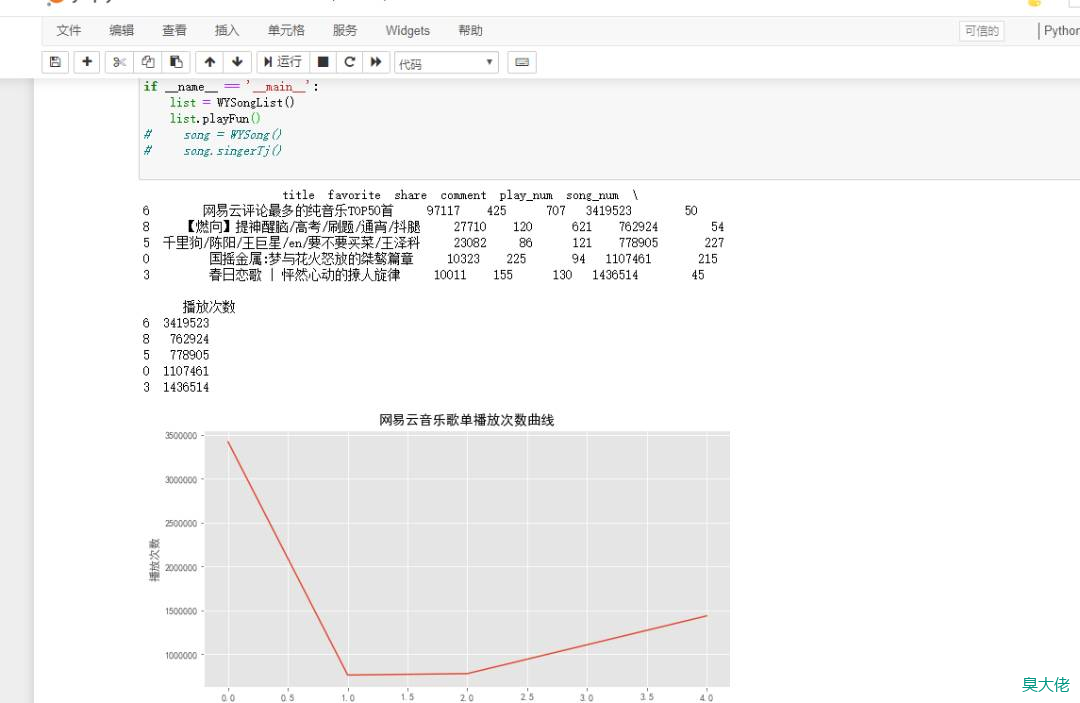
播放次数统计
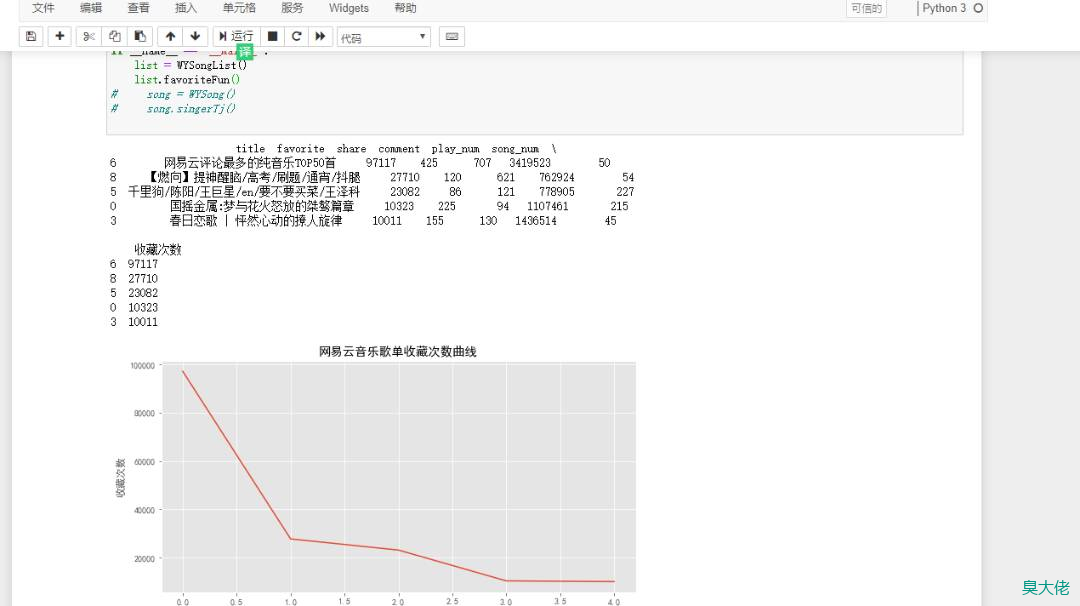
收藏次数
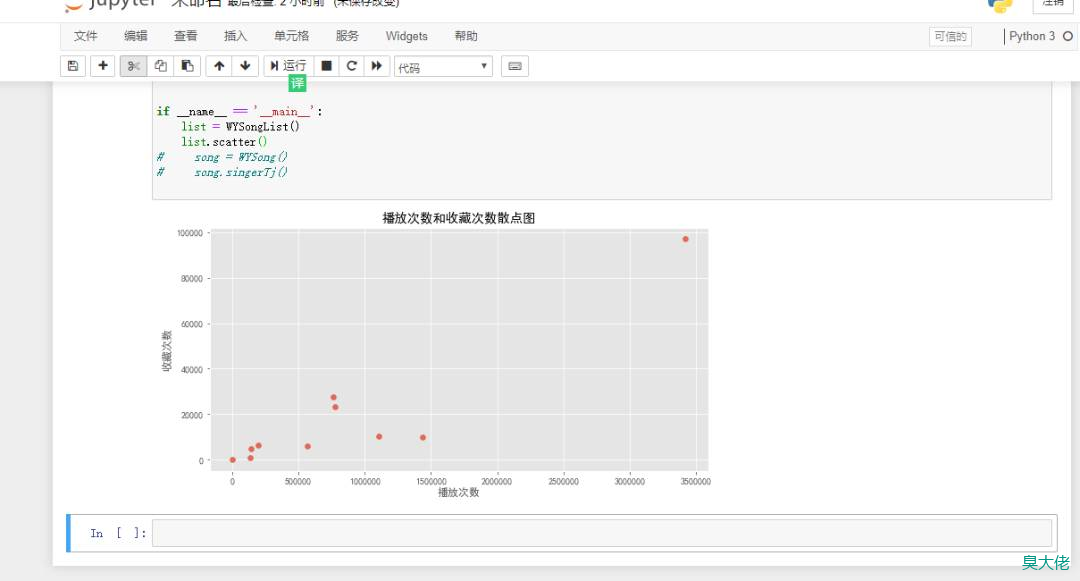
散点图


 微信收款码
微信收款码 支付宝收款码